| Q3 • 2024 |
TMGMultifamily
MARKET PULSE
A Snapshot of the Pacific Northwest Multifamily Housing Market
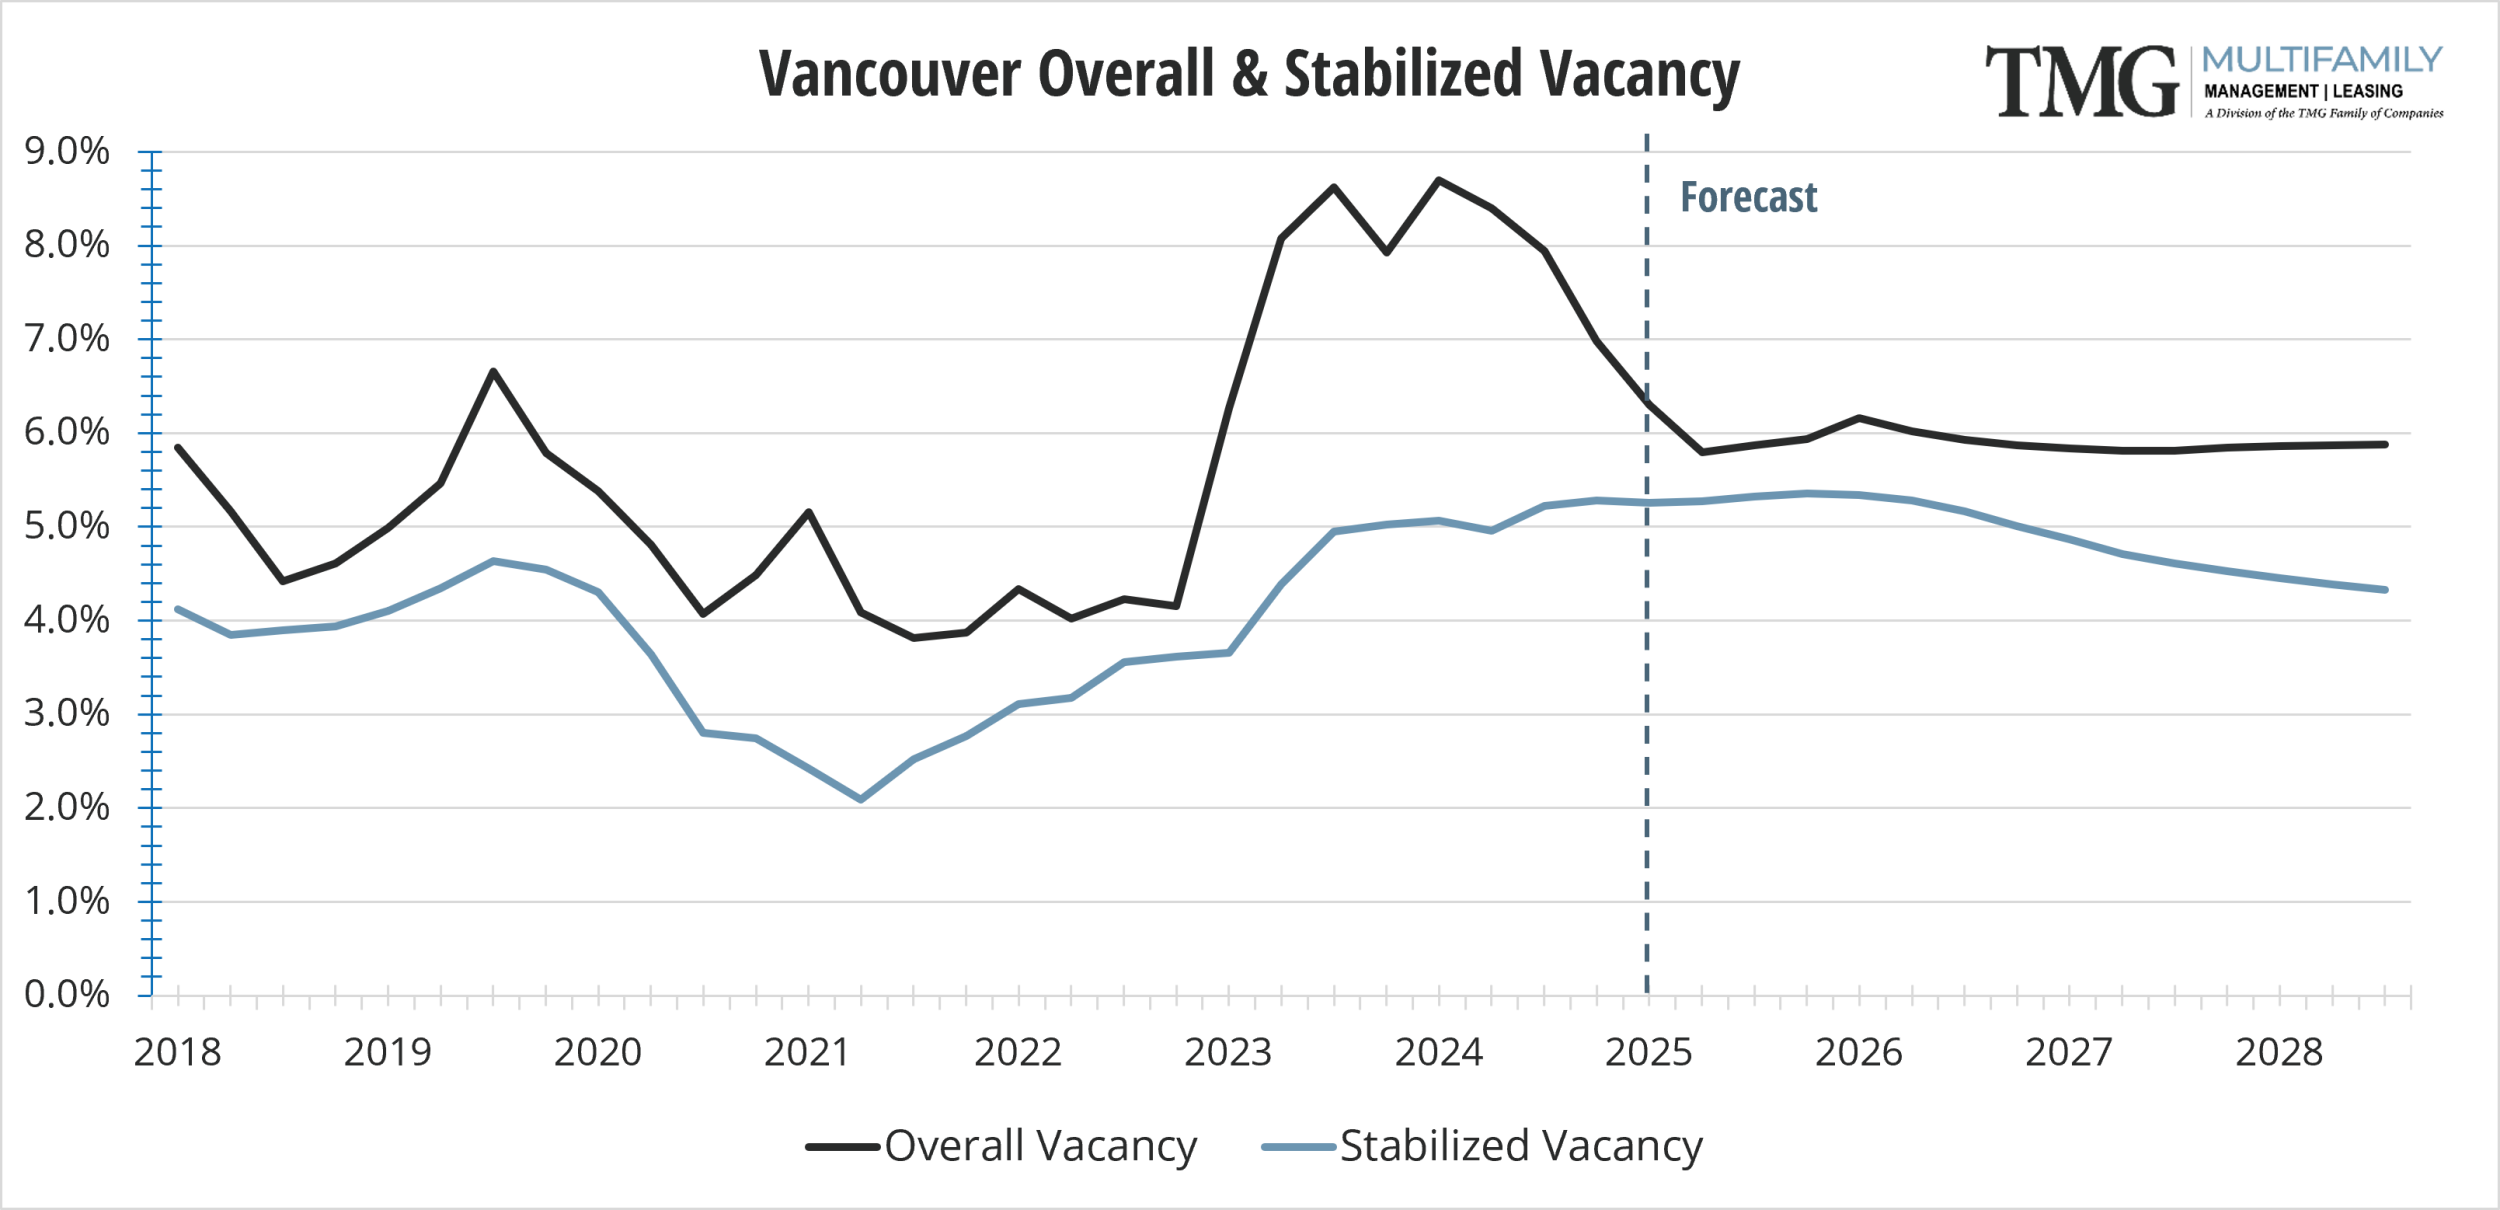
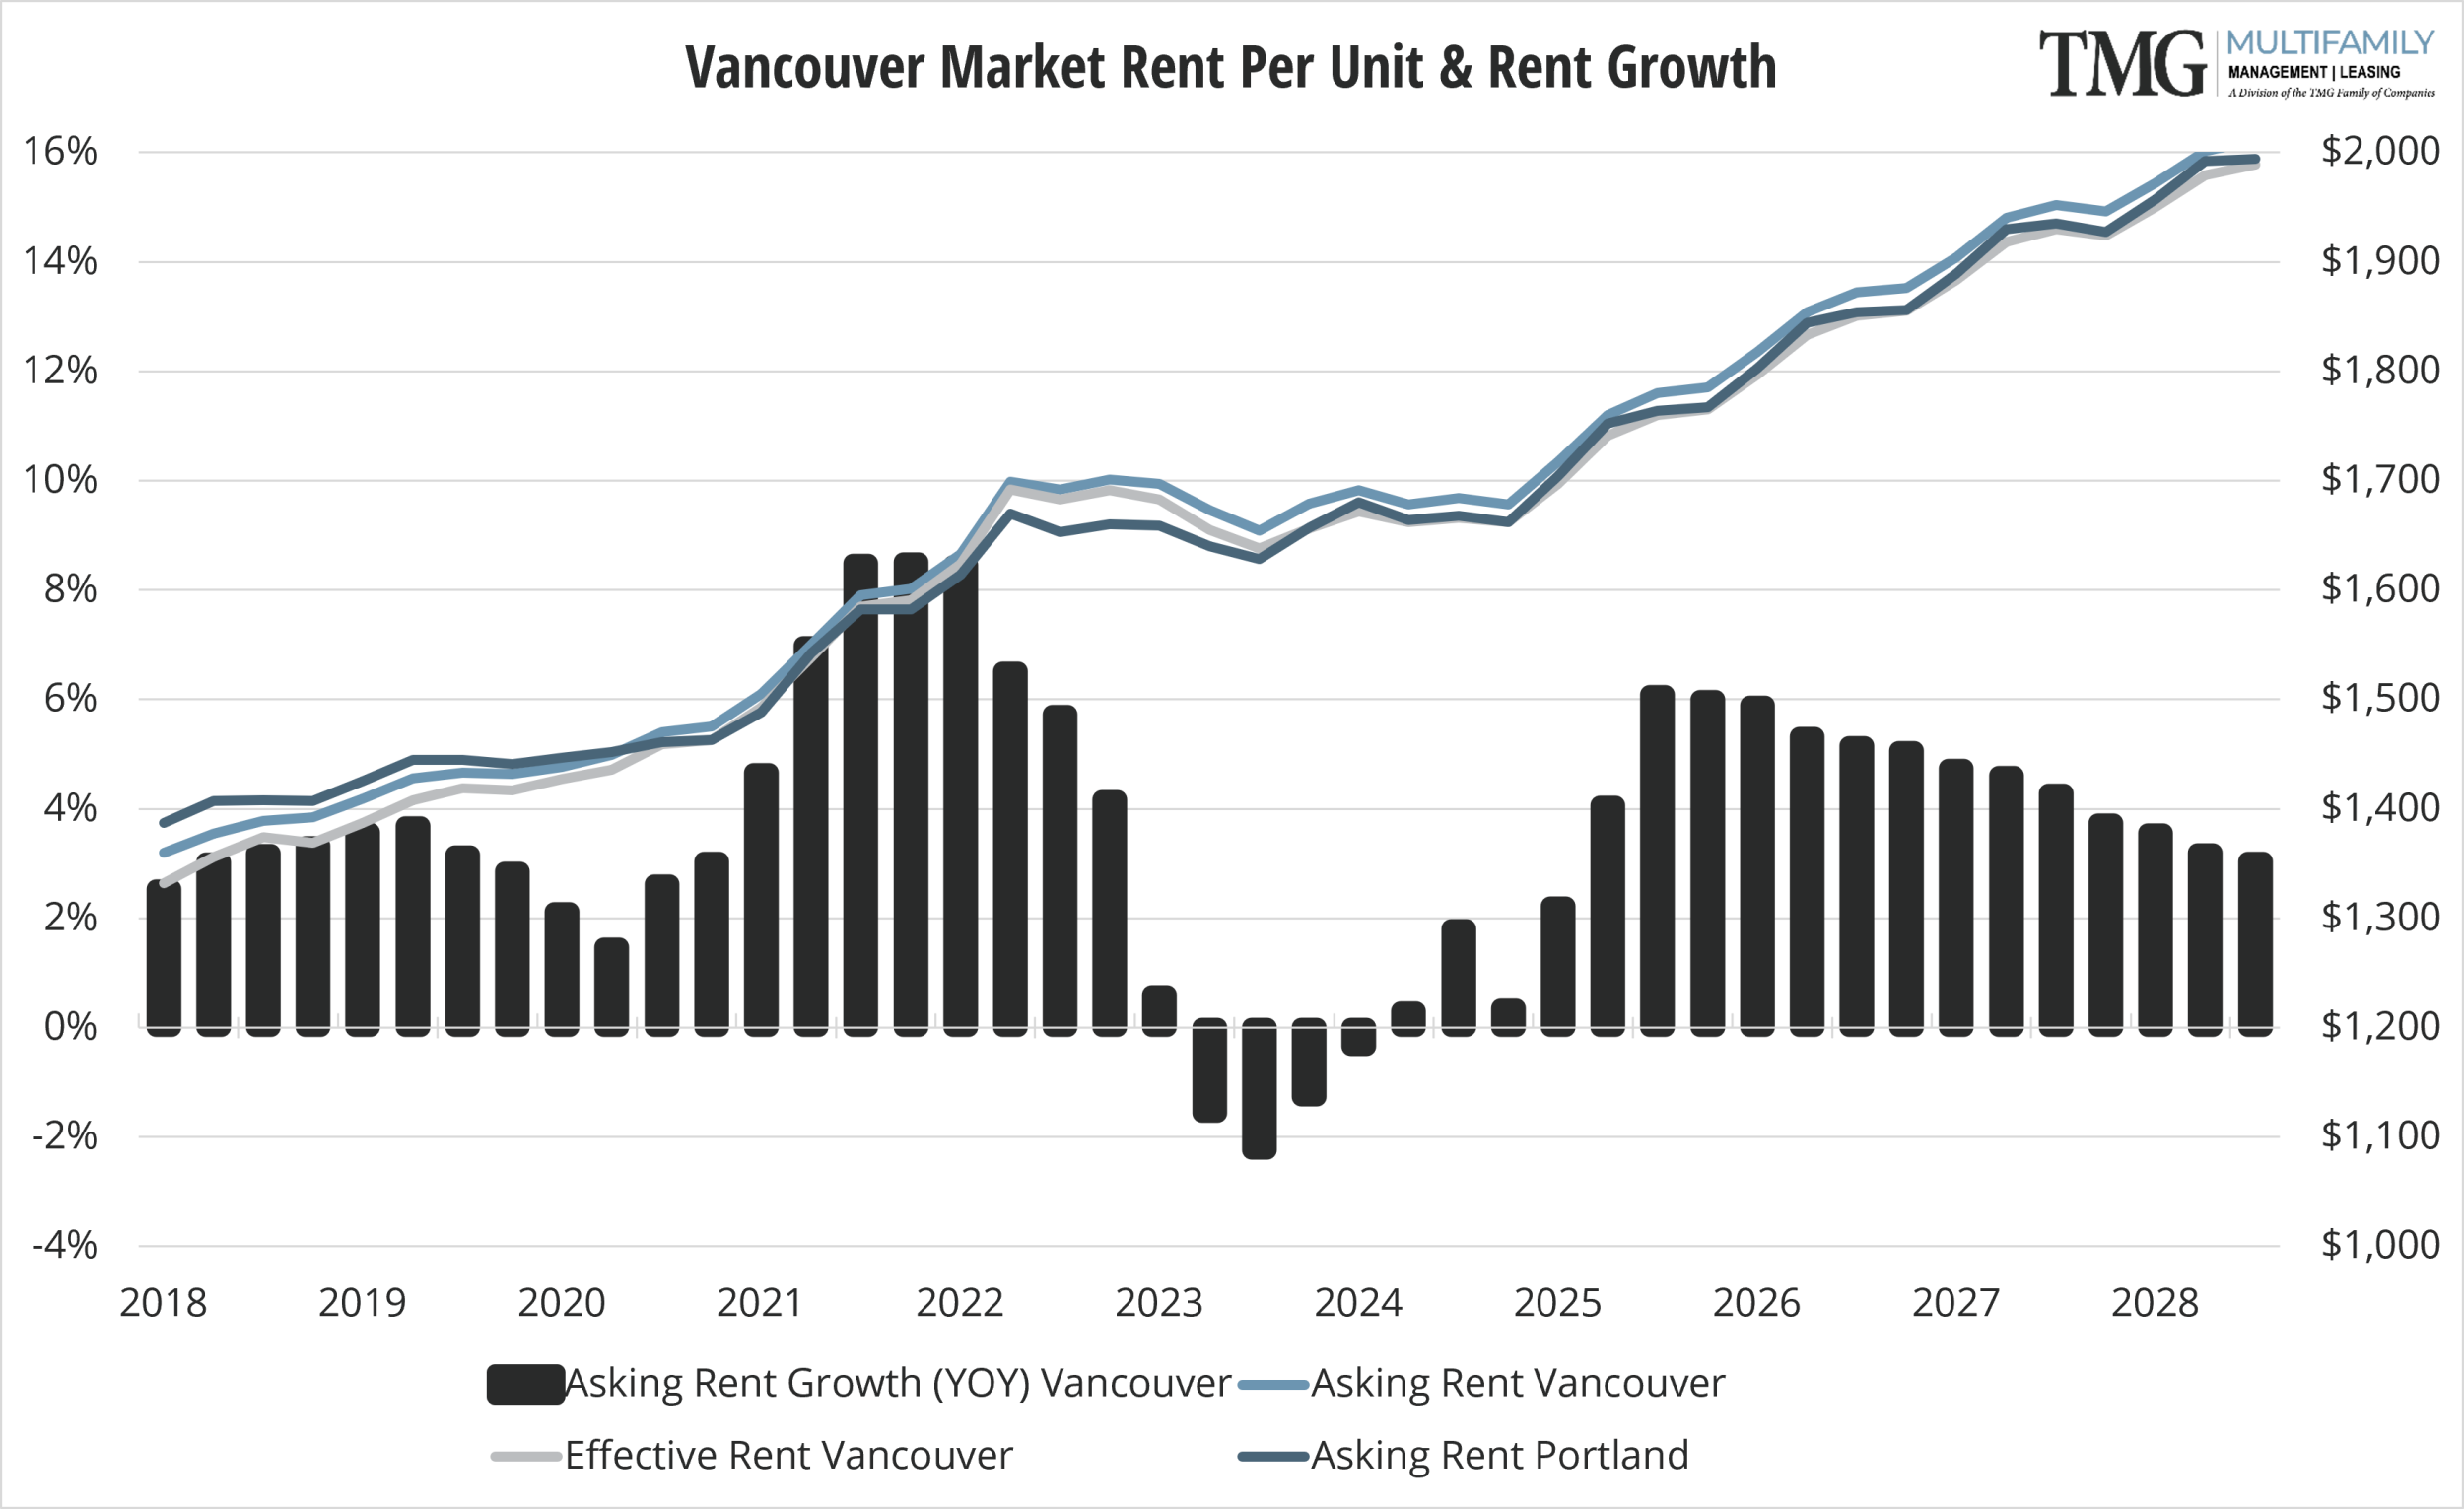
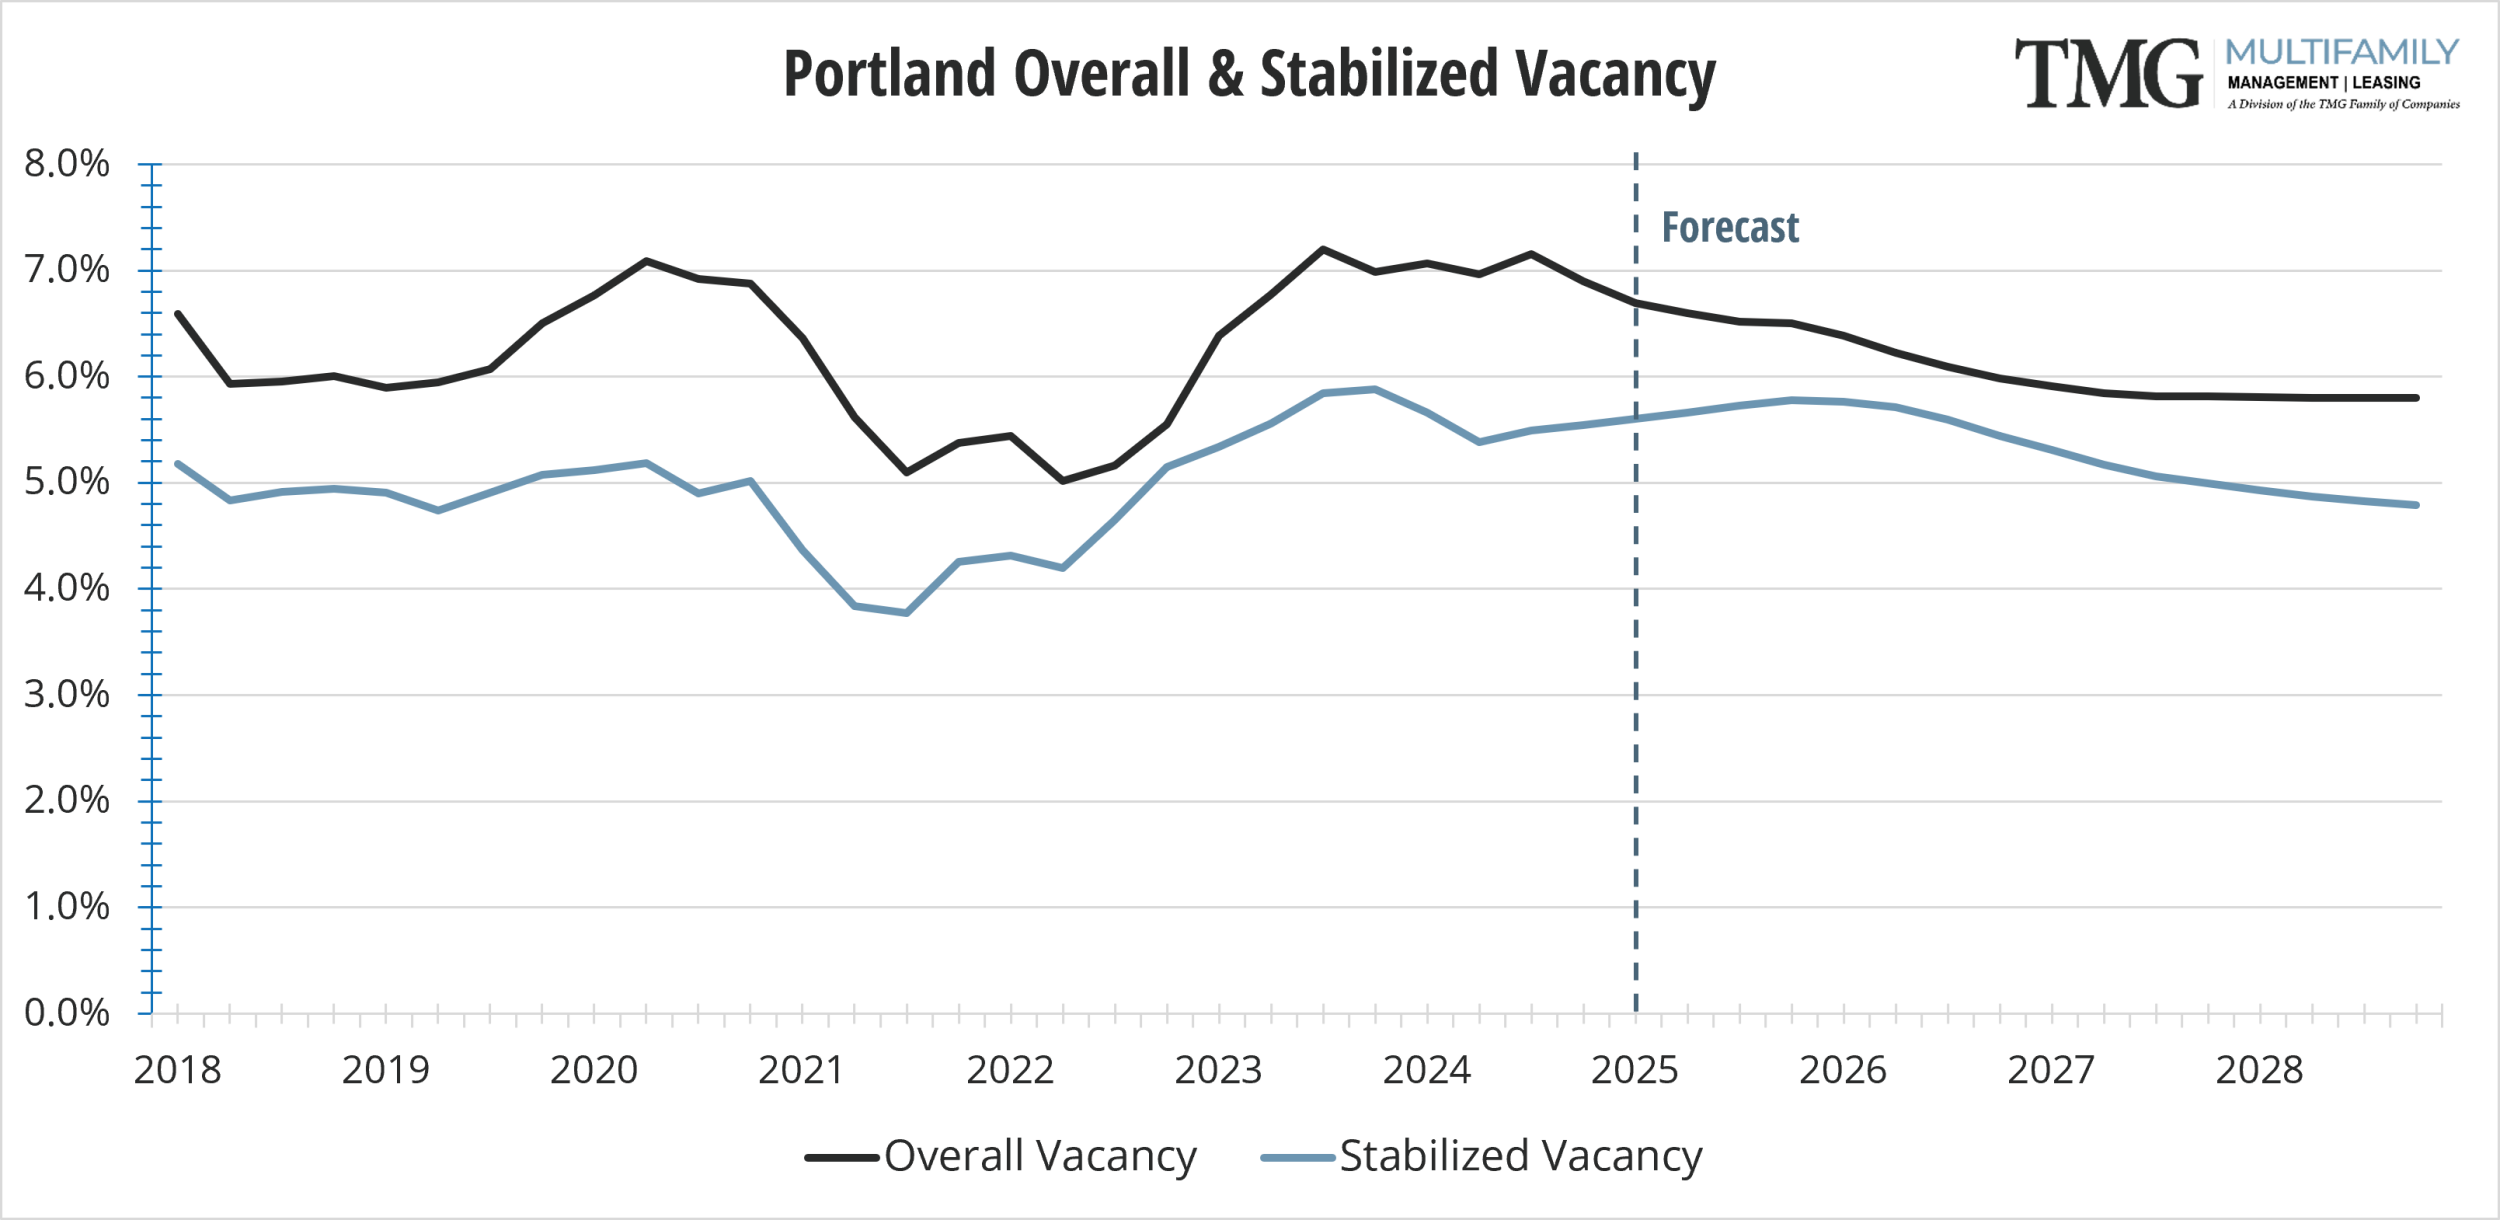
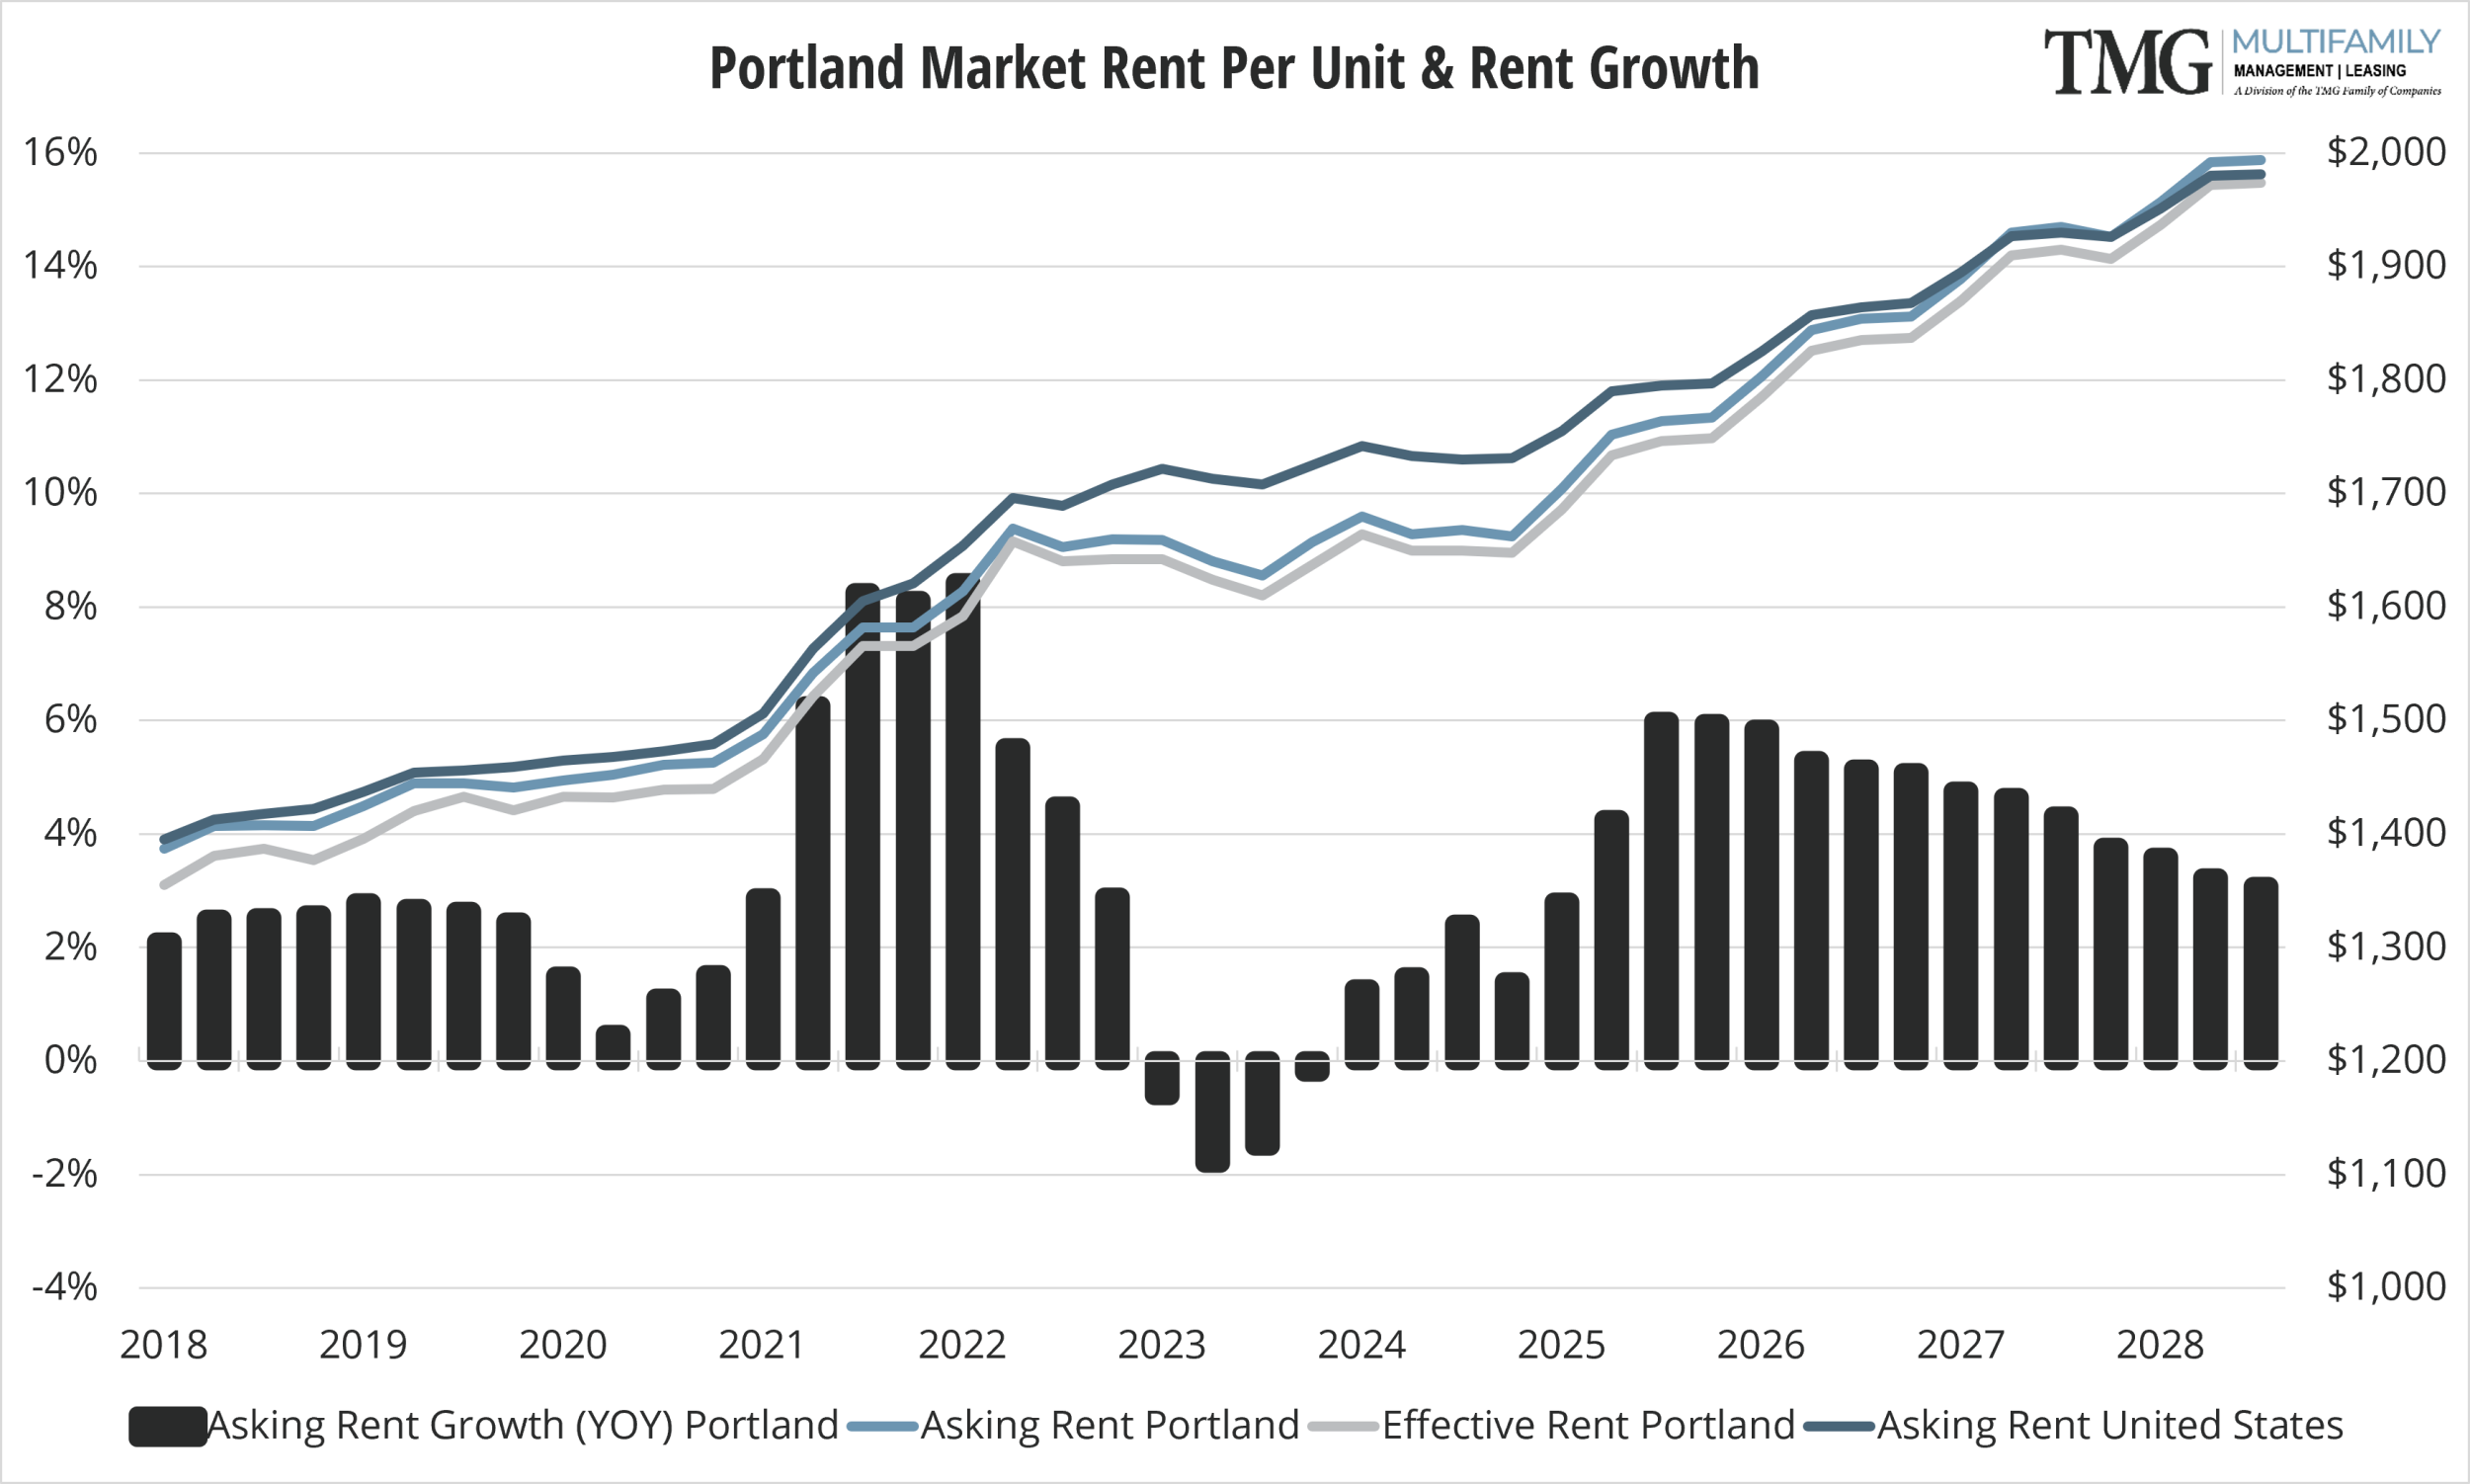
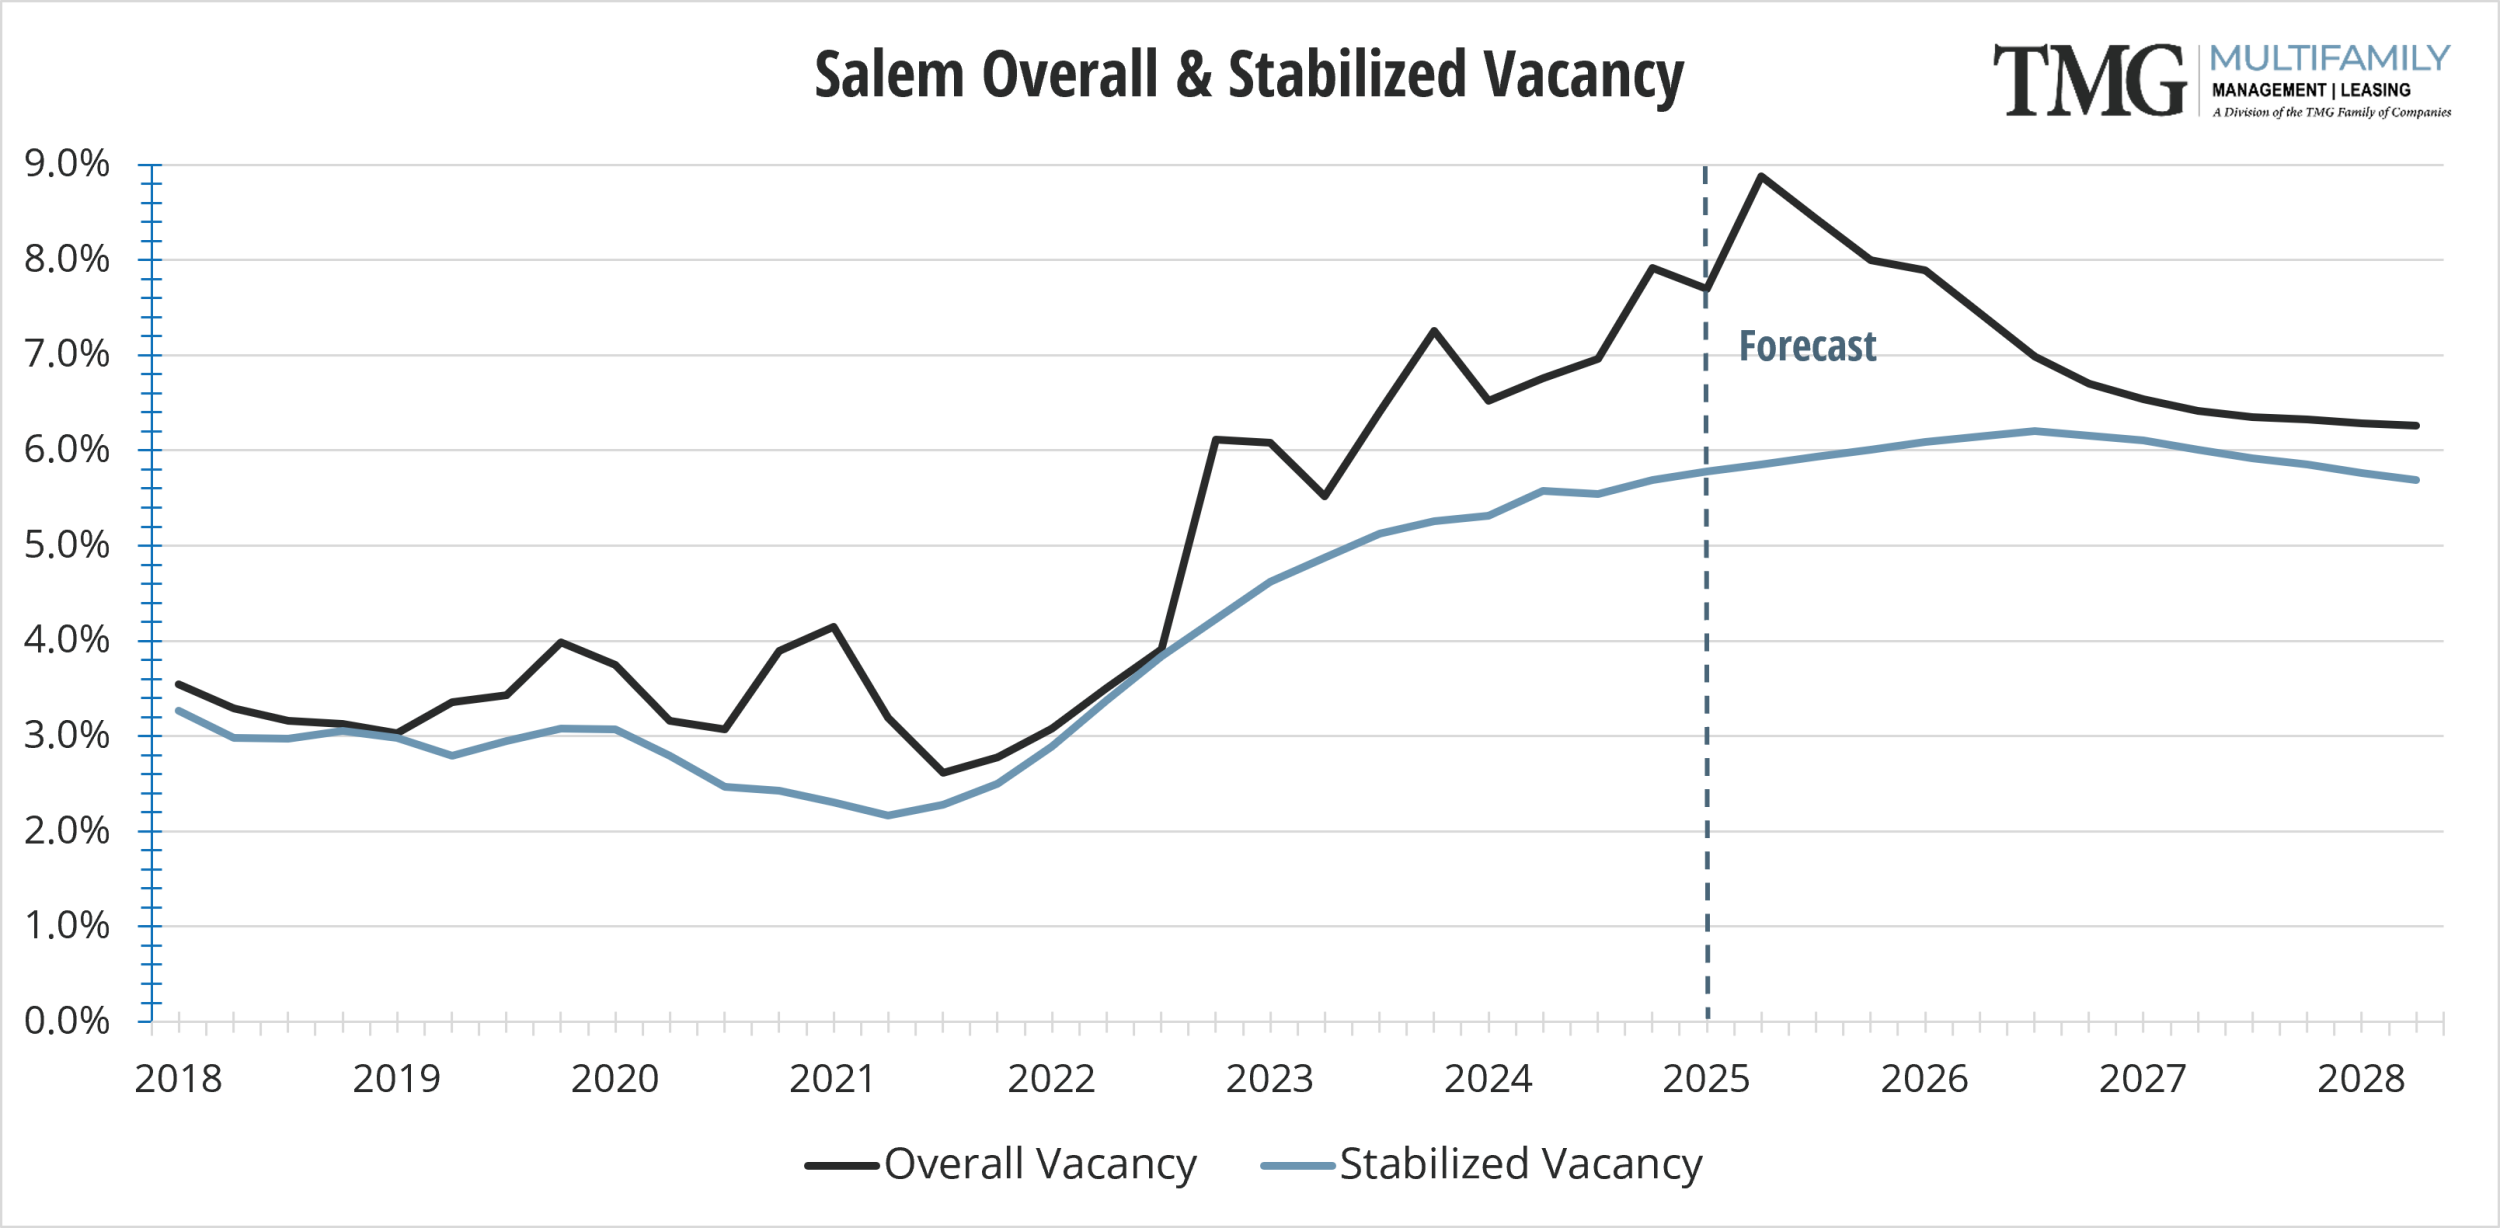
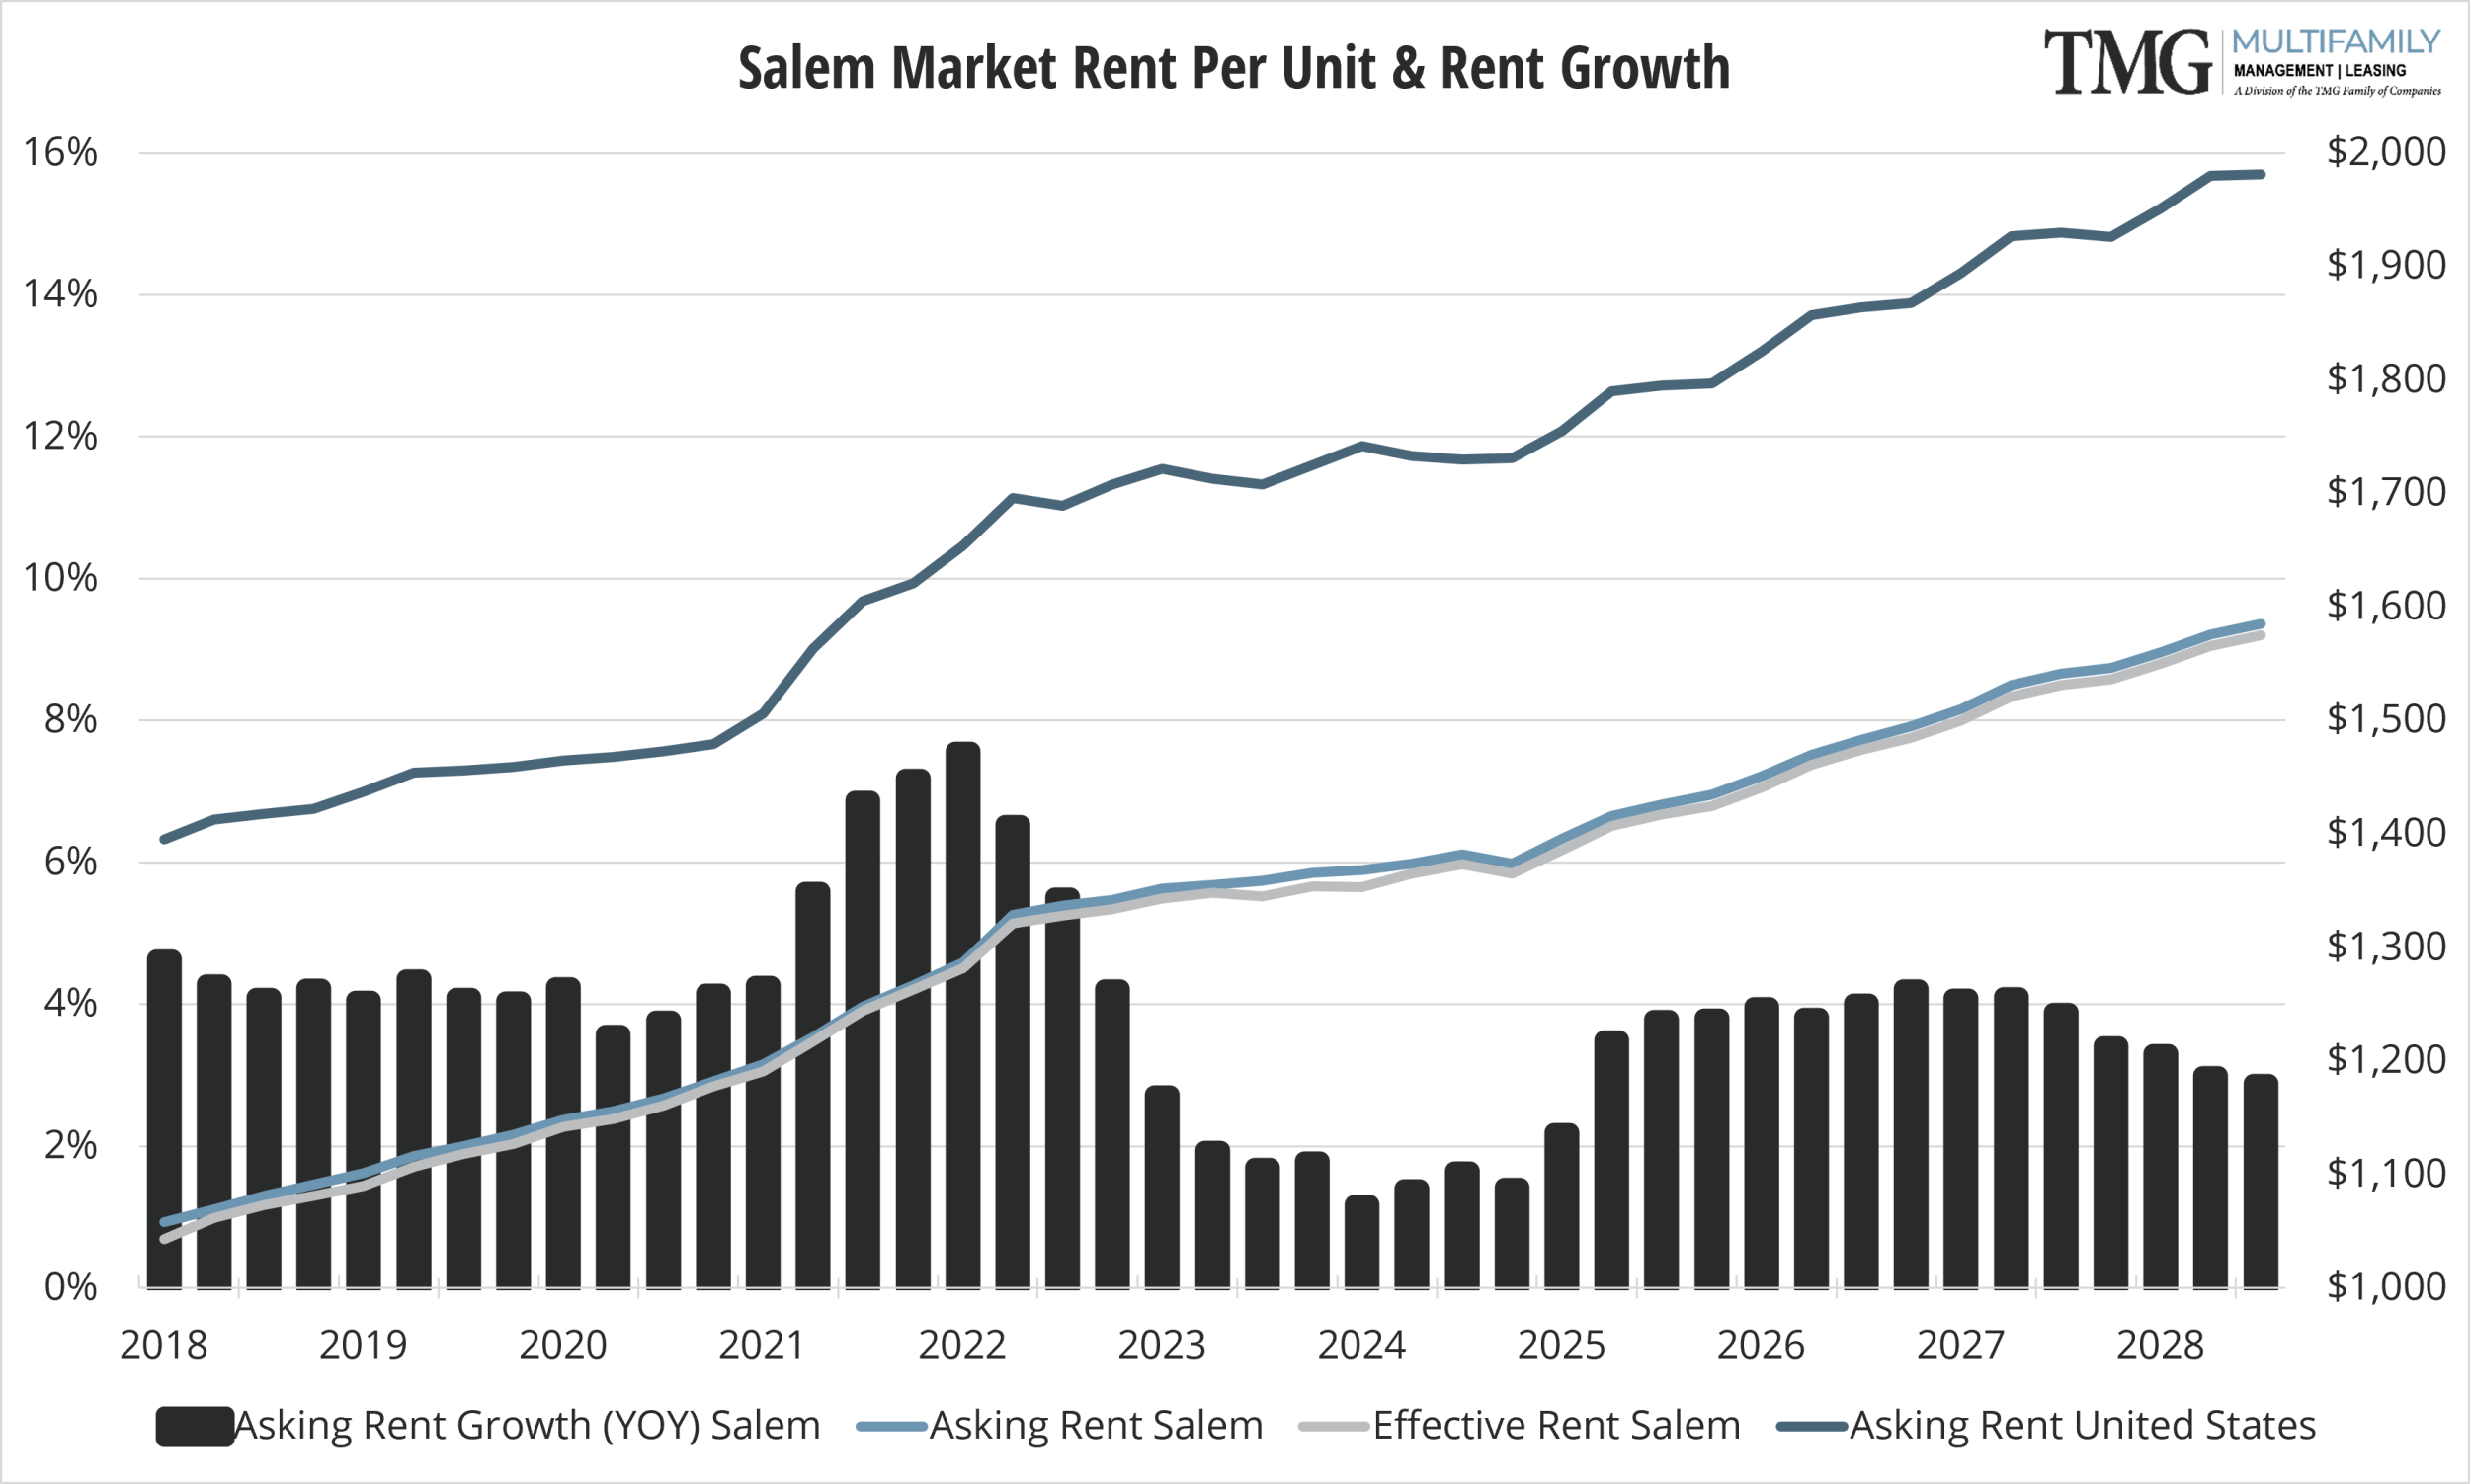
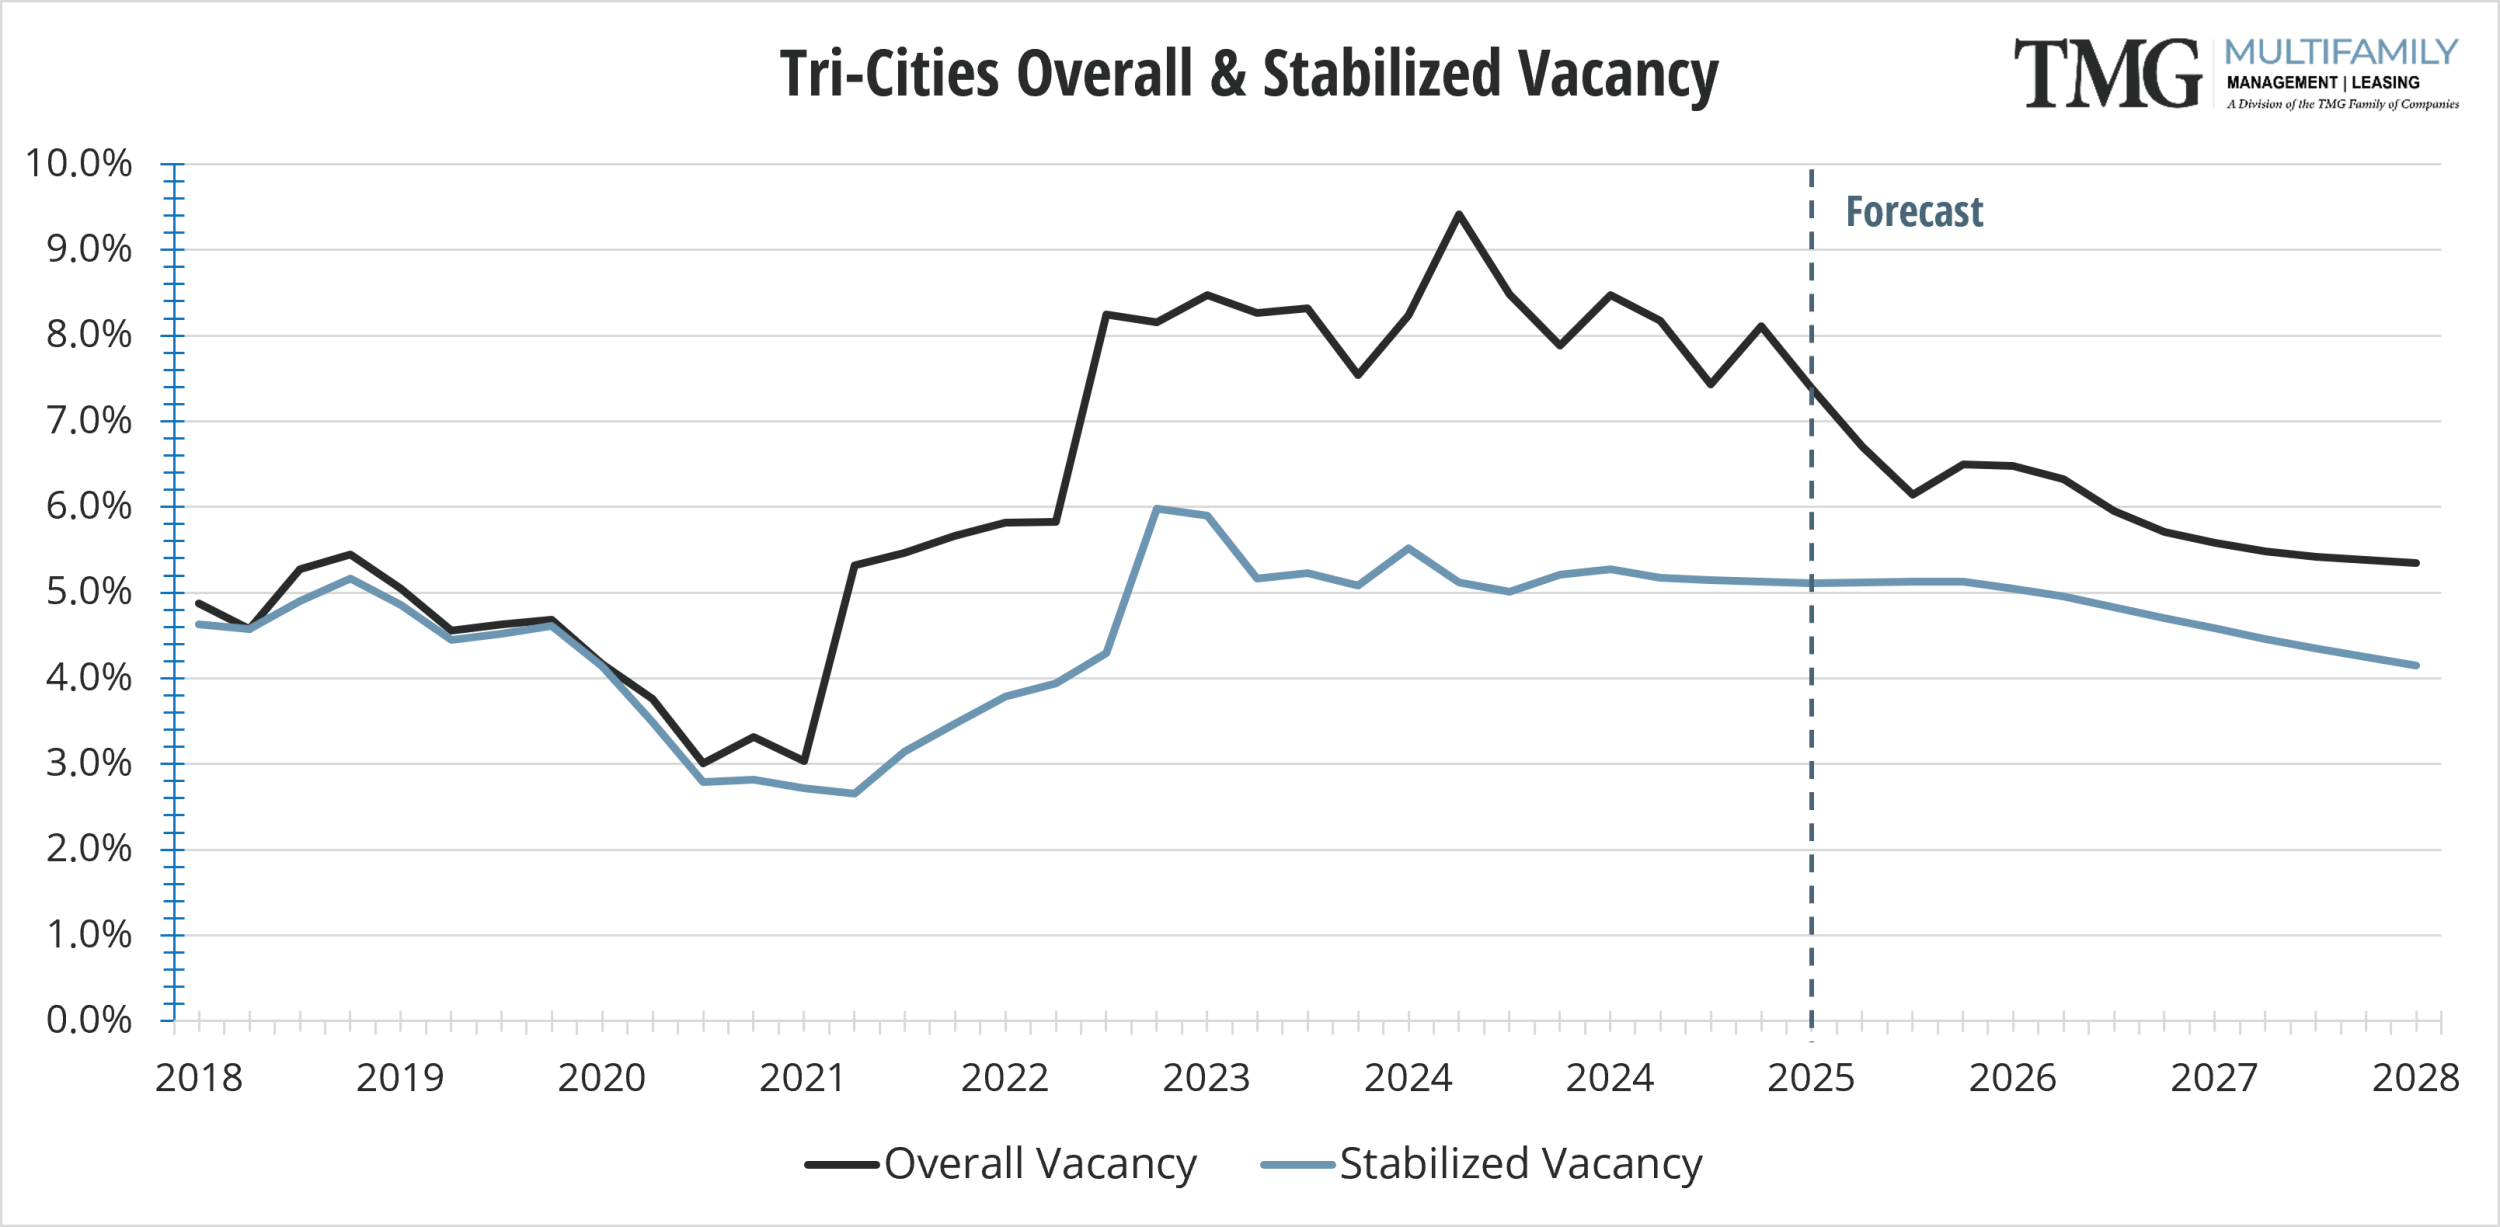
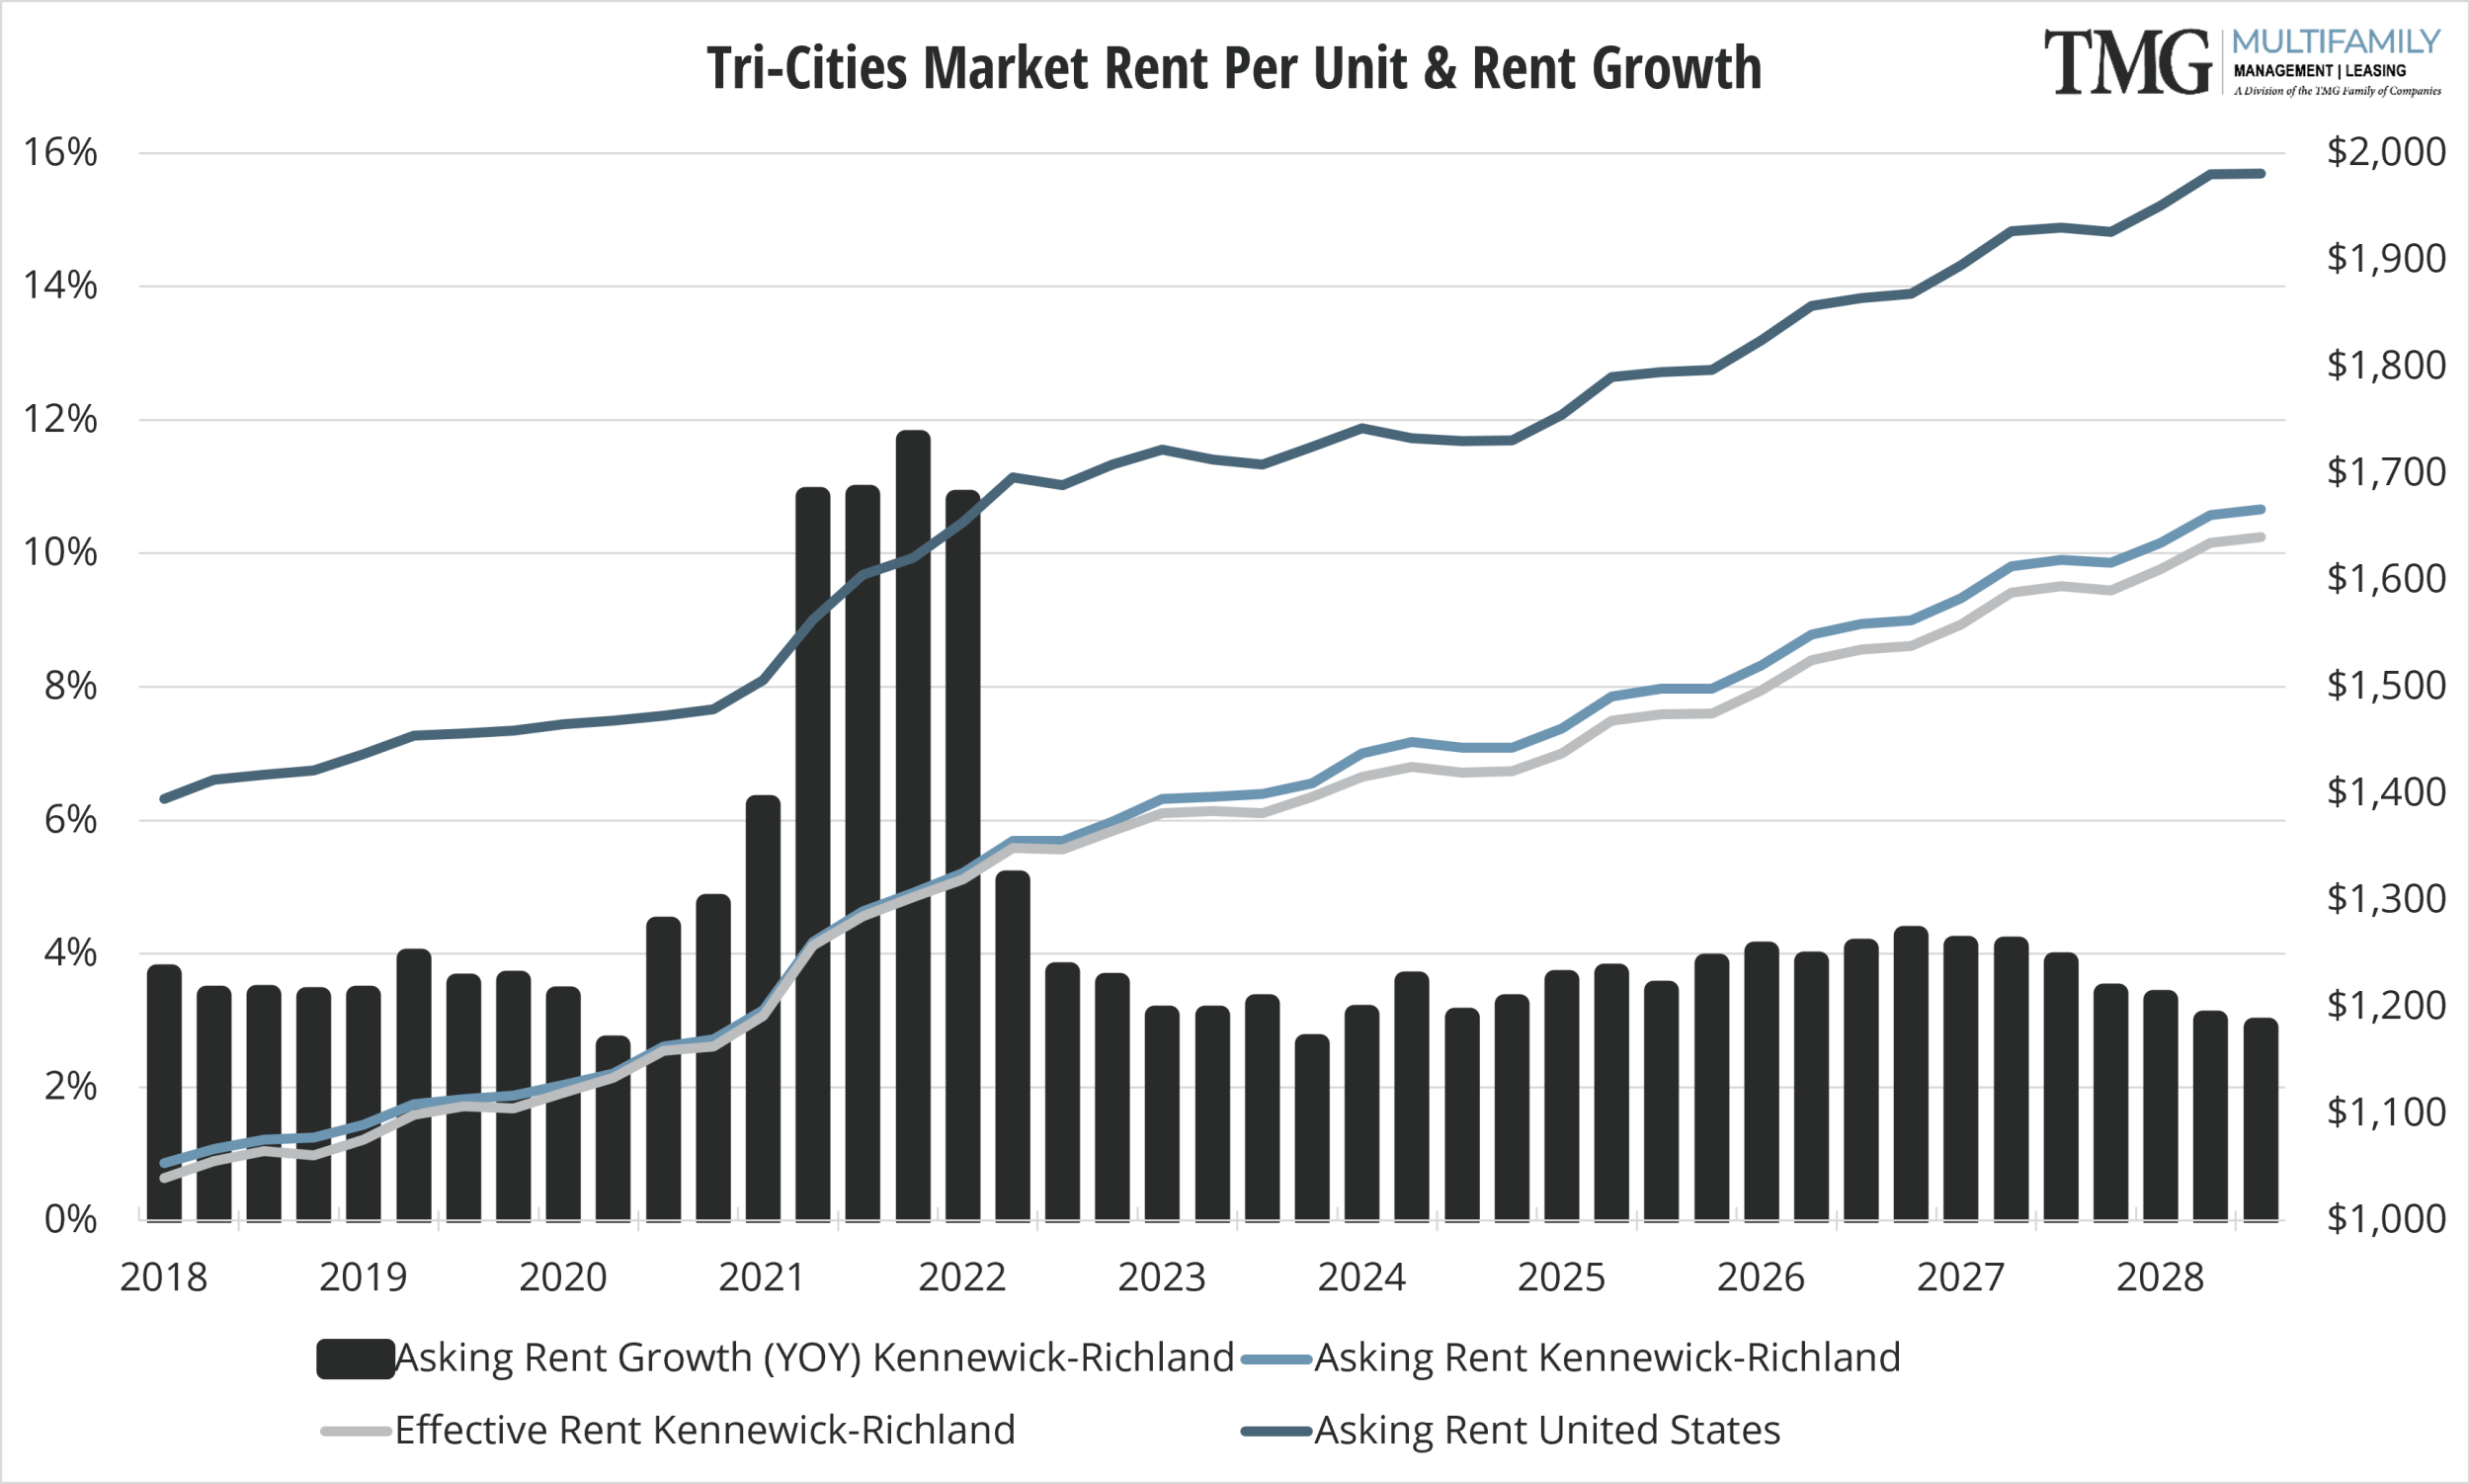
All four markets experienced some improvement in the 12-month asking rent growth. Vancouver, Salem, and Tri-Cities have a decrease in vacancy rates over Q2 2024, while Portland had a slight increase. Vancouver vacancy moved from 8.3% in Q2 2024 to 7.9% Q3 2024, Portland from 6.8% in Q2 2024to 7.1% in Q3 2024, Salem from 7.3% in Q2 2024 to 6.9% in Q3 2024 and Tri-Cities from 9.5% in Q2 2024 to 8.5% in Q3 2024. Luxury apartments in all markets have profoundly impacted the vacancy rates as many of these recently delivered units are classified as 4 & 5 star properties.
From an economic perspective, Vancouver remains the best-performing area in the region for net positive population growth in the most recently reported period. Job opportunities and tax benefits account for much of the in-migration to Vancouver from Portland. Tri-Cities is expected to outpace the nation and other Pacific Northwest metros for economic growth, and the population is projected to expand more rapidly on a percentage basis than that of the nation. Along with strong income growth, this could push the average rent growth closer to the MSA metros. Salem continues to benefit from more affordable housing options than Portland and still offers reasonable commute times to Portland job hubs. Portland is often entrenched with some controversy from the economic and livability standpoint as well as political discourse. This along with the lack of new affordable units (five luxury units under construction for every 3 star units in the pipeline), has caused tenants to move to surrounding fringe markets where 3/2/1 star units are more available.
The big “wave” of new deliveries has passed in all markets, although concessions in all markets for new construction apartments continue to be prevalent. Looking ahead, an elevated interest rate environment and stagnant construction lending should continue to curb apartment starts through the remainder of 2024 and into 2025.
All data in this report is pulled from CoStar.


